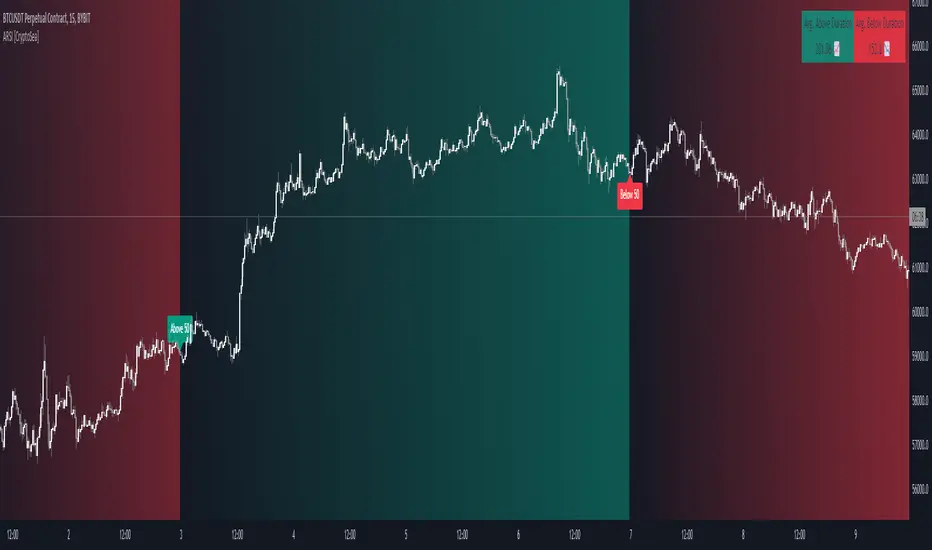
Advanced RSI [CryptoSea]The Advanced RSI Duration (ARSI) is a unique tool crafted to deepen your market insights by focusing on the duration the Relative Strength Index (RSI) spends above or below key thresholds. This innovative approach is designed to help traders anticipate potential market reversals by observing sustained overbought and oversold conditions.
Core Feature
Duration Monitoring ARSI's standout feature is its ability to track how long the RSI remains in overbought (>70) or oversold (<30) conditions. By quantifying these durations, traders can gauge the strength of current market trends and the likelihood of reversals.
Enhanced Functionality
Multi-Timeframe Flexibility : Analyze the RSI duration from any selected timeframe on your current chart, offering a layered view of market dynamics.
Customizable Alerts : Receive notifications when the RSI maintains its position above or below set levels for an extended period, signaling sustained market pressure.
Visual Customization : Adjust the visual elements, including colors for overbought and oversold durations, to match your analytical style and preferences.
Label Management : Control the frequency of labels marking RSI threshold crossings, ensuring clarity and focus on significant market events.
Settings Overview
RSI Timeframe & Length : Tailor the RSI calculation to fit your analysis, choosing from various timeframes and period lengths.
Threshold Levels : Define what you consider overbought and oversold conditions with customizable upper and lower RSI levels.
Duration Alert Threshold : Set a specific bar count for how long the RSI should remain beyond these thresholds to trigger an alert.
Visualization Options : Choose distinct colors for durations above and below thresholds, and adjust label visibility to suit your charting approach.
Application & Strategy
Use ARSI to identify potential turning points in the market
Trend Exhaustion : Extended periods in overbought or oversold territories may indicate a strong trend but also warn of possible exhaustion and impending reversals.
Comparative Analysis : By evaluating the current duration against historical averages, traders can assess the relative strength of ongoing market conditions.
Strategic Entries/Exits : Utilize duration insights to refine entry and exit points, capitalizing on the predictive nature of prolonged RSI levels.
Alert Conditions
The Advanced RSI (ARSI) offers critical alert mechanisms to aid traders in identifying prolonged market conditions that could lead to actionable trading opportunities. These conditions are designed to alert traders when the RSI remains at extremes longer than typical durations, signaling sustained market behaviors.
Above Upper Level Alert: This alert is triggered when the RSI sustains above the upper threshold (usually 70) for more than the configured duration, indicating strong bullish momentum or potential overbought conditions.
Below Lower Level Alert: Similarly, this alert is activated when the RSI stays below the lower threshold (commonly 30) for an extended period, suggesting significant bearish momentum or potential oversold conditions.
These alerts enable traders to respond swiftly to extend market conditions, enhancing their strategy by providing timely insights into potential trend reversals or continuations.
The Advanced RSI Duration Analysis empowers traders with a nuanced understanding of market states, beyond mere RSI values. It highlights the significance of how long markets remain in extreme conditions, offering a predictive edge in anticipating reversals. Whether you're strategizing entries or preparing for shifts in market momentum, ARSI is your companion for informed trading decisions.
Cerca negli script per "relative strength"
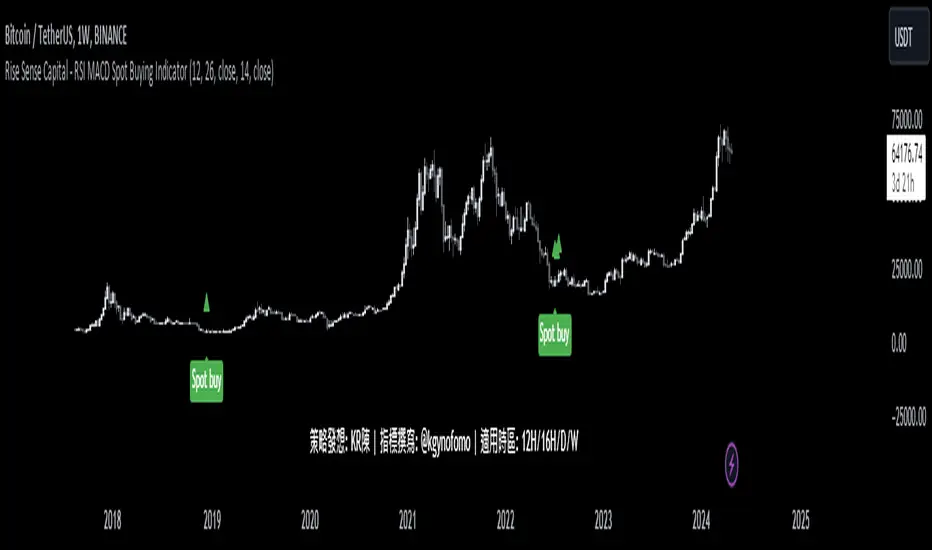
Rise Sense Capital - RSI MACD Spot Buying IndicatorToday, I'll share a spot buying strategy shared by a member @KR陳 within the DATA Trader Alliance Alpha group. First, you need to prepare two indicators:
今天分享一個DATA交易者聯盟Alpha群組裏面的群友@KR陳分享的現貨買入策略。
首先需要準備兩個指標
RSI Indicator (Relative Strength Index) - RSI is a technical analysis tool based on price movements over a period of time to evaluate the speed and magnitude of price changes. RSI calculates the changes in price over a period to determine whether the recent trend is relatively strong (bullish) or weak (bearish).
RSI指標,(英文全名:Relative Strength Index),中文稱為「相對強弱指標」,是一種以股價漲跌為基礎,在一段時間內的收盤價,用於評估價格變動的速度 (快慢) 與變化 (幅度) 的技術分析工具,RSI藉由計算一段期間內股價的漲跌變化,判斷最近的趨勢屬於偏強 (偏多) 還是偏弱 (偏空)。
MACD Indicator (Moving Average Convergence & Divergence) - MACD is a technical analysis tool proposed by Gerald Appel in the 1970s. It is commonly used in trading to determine trend reversals by analyzing the convergence and divergence of fast and slow lines.
MACD 指標 (Moving Average Convergence & Divergence) 中文名為平滑異同移動平均線指標,MACD 是在 1970 年代由美國人 Gerald Appel 所提出,是一項歷史悠久且經常在交易中被使用的技術分析工具,原理是利用快慢線的交錯,藉以判斷股價走勢的轉折。
In MACD analysis, the most commonly used values are 12, 26, and 9, known as MACD (12,26,9). The market often uses the MACD indicator to determine the future direction of assets and to identify entry and exit points.
在 MACD 的技術分析中,最常用的值為 12 天、26 天、9 天,也稱為 MACD (12,26,9),市場常用 MACD 指標來判斷操作標的的後市走向,確定波段漲幅並找到進、出場點。
Strategy analysis by member KR陳:
策略解析 by群友 KR陳 :
Condition 1: RSI value in the previous candle is below oversold zone(30).
條件1:RSI 在前一根的數值低於超賣區(30)
buycondition1 = RSI <30
Condition 2: MACD histogram changes from decreasing to increasing.
條件2:MACD柱由遞減轉遞增
buycondition2 = hist >hist and hist
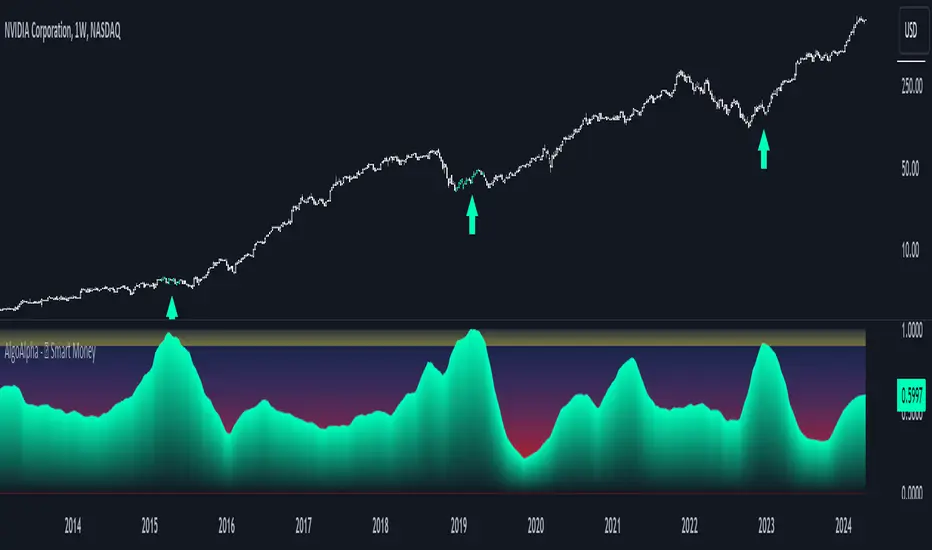
Smart Money Interest Index [AlgoAlpha]🌟 Smart Money Interest Index by AlgoAlpha 🌟
Welcome to the innovative Smart Money Interest Index indicator, designed meticulously by AlgoAlpha to revolutionize the way you trade! 📈🧠 This indicator is engineered to decipher the activities of smart money investors relative to the less informed (dumb money) and dynamically display their dominance in the trading landscape through a sophisticated visual index. 🚀💹
🔑 Key Features:
- Smart vs. Dumb Money Analysis: Tracks and compares the movements of smart money (informed investors) and dumb money (general public) within the market to identify potential investment signals.
- Relative Strength Index (RSI) Based Ratios: Utilizes RSI for both smart and dumb money to create a ratio that indicates buying or selling pressures.
- Dynamic Normalization: Employs a long-term peak normalization over a customizable period to ensure the index remains relevant regardless of market conditions.
- Visual Thresholds and Signals: Highlights significant shifts in market dynamics with color-coded thresholds, making it easier to spot changes at a glance.
🛠 How to Use the Smart Money Interest Index:
🔹 🚀 Step 1: Adding the Indicator
- Add the indicator to your favourites.
- Customize the settings according to your analysis needs:
- `Index Period`, `Volume Flow Period`, `Normalization Period`, `High Interest Threshold`
🔹 📊 Step 2: Interpretation of the Index
- Monitor the index plot; a rising index suggests increasing smart money interest, potentially indicating a buying opportunity.
- A value above the high interest threshold (in yellow) highlights significant interest by smart money, suggesting a good time to buy.
🔹 🔔 Step 3: Setting Alerts
- Configure alerts to notify you when the index crosses above the set threshold, enabling you to capitalize on trading opportunities timely and efficiently.
📐 Basic Logic Overview:
The Smart Money Interest Index by AlgoAlpha provides a unique metric that contrasts the investment behaviors of informed (smart money) and general (dumb money) investors. Utilizing the Relative Strength Index (RSI), this indicator evaluates the trading pressure exerted by both groups over specified periods, then forms a ratio of these activities to identify dominance in buying or selling trends. For example, when we see dumb money selling and smart buying, this suggests that the conditions for buying the asset is optimal as smart money is willing to buy the dip. The outputs are normalized against the highest values observed in a user-defined term to maintain consistency through varying market conditions. When the index exceeds a certain threshold, it suggests that smart money presence is particularly strong, possibly indicating that smart money is looking to enter positions on the asset. This tool serves as a sophisticated visual guide to understanding market dynamics and making well-informed trading decisions based on the activities of market-savvy investors. Smart money activity is identified during areas of low volume and the opposite for dumb money, the indicator uses the NVI and PVI metrics as its foundation for smart and dumb money analysis.
📊 Enhance Your Trading Strategy:
Leverage the Smart Money Interest Index to gain deeper insights into market dynamics and enhance your decision-making process with a powerful, data-driven approach. Whether you're looking to identify entry points or set strategic exits, this tool is designed to provide you with the competitive edge you need in the fast-paced world of trading. 🌐✨
Transform your trading with the power of smart money analysis—start using the Smart Money Interest Index today! 🚀🔔
RSI Confirm Trend with Williams (W%R)RSI Confirm Trend with Williams (W%R)
This is the "RSI Confirm Trend with Williams (W%R)" indicator
This is a modification of the "RSI Trends" indicator by zzzcrypto123.
What Is the Relative Strength Index (RSI)?
The relative strength index (RSI) is a momentum indicator used in technical analysis. RSI measures the speed and magnitude of a security's recent price changes to evaluate overvalued or undervalued conditions in the price of that security.
What is Williams %R?
Williams %R, also known as the Williams Percent Range, is a type of momentum indicator that moves between 0 and -100 and measures overbought and oversold levels. The Williams %R may be used to find entry and exit points in the market. The indicator is very similar to the Stochastic oscillator and is used in the same way. It was developed by Larry Williams and it compares a stock’s closing price to the high-low range over a specific period, typically 14 days or periods.
How Does "RSI Confirm Trend with Williams (W%R)" work?
This indicator combines the momentum of both RSI and Williams %R by adding upper and lower thresholds. When the thresholds are broken, this indicator changes color from gray to either green or red.
What Are The Thresholds?
The default RSI thresholds are 55 and 45. These values are configurable.
The default Williams %R thresholds are 80 and 20. These values are configurable and made positive so it can be plotted against the RSI line.
How To Use?
When the RSI exceeded the upper/lower thresholds, the RSI line color will change from gray to lighter green/red color.
When the Williams %R exceeded the upper/lower thresholds, the RSI color will change to darker green/red color signifying a strong momentum in that direction.
When the RSI color is gray, this means the RSI and Williams %R thresholds are not broken which can also signify as no trend or consolidation.
The Williams %R line is not displayed by default but can be enabled using the checkbox provided in the Style tab.
This "RSI Confirm Trend with Williams (W%R)" indicator can be combined with other technical indicators to verify the idea behind this theory.
-----------------
Disclaimer
The information contained in this indicator does not constitute any financial advice or a solicitation to buy or sell any securities of any type.
My scripts/indicators/ideas are for educational purposes only!

RSI Overbought/Oversold [Overlay Highlighter]Indicator to show when the RSI is in oversold(Below 30) or overbought (Above 70) conditions. The background color of the chart changes colors in the areas where the above conditions are met.
Price can often reverse in these areas. However, this depends on the strength of the trend and price may continue higher or lower in the direction of the overall trend.
Divergence has been added to aid the user in timing reversals. Divergences are plotted by circles above or below the candles. Divergence is confirmed so there is a delay of one candle before the signal is given on the previous candle. Again, everything depends on the strength of the trend so use proper risk management.
Once the RSI has entered into oversold/overbought conditions, it is recommended to wait for divergence before entering into the trade near areas of support or resistance. It is recommended to utilize this strategy on the H4 timeframe, however, this particular strategy works on all timeframes.
This indicator is a modified version of seoco's RSI Overbought/Oversold + Divergence Indicator . The user interface has been refined, is now overlayed on the chart, and my own divergence code has been inserted.

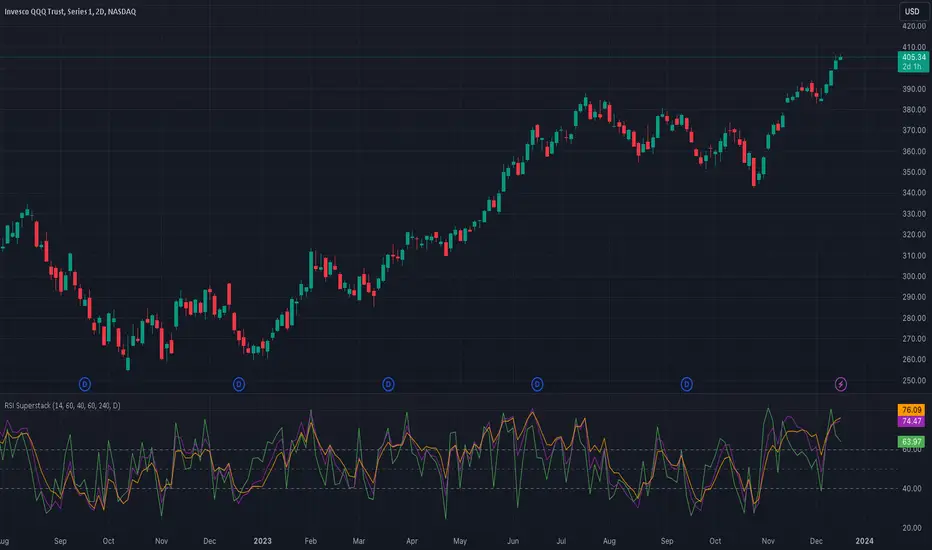
RSI SuperstackThis script integrates three Relative Strength Index (RSI) indicators across multiple time frames, providing a comprehensive overview of oversold and overbought conditions. This holistic approach enhances the precision of entry and exit points on shorter time frames.
As a momentum indicator, the Relative Strength Index assesses a security's strength during upward and downward price movements within the specified time period.
In a broader context, an upward slope in all indicators (green, purple, and orange) signifies an increasing market momentum, suggesting a potential continuation of the upward trend.
More specifically, a collective upward slope reaching or surpassing the 40 level in all indicators serves as a buy signal. Conversely, a uniform downward slope descending to or below the 60 level in all indicators constitutes a sell signal.
The default time frames for analysis include:
- 1 Hour (1H)
- 4 Hours (4H)
- Daily (D)
It is imperative to note that this indicator should not serve as the sole determinant for initiating long or short positions. Instead, it is recommended to consider it as part of a broader analysis, incorporating factors such as trend analysis and significant support levels.
Disclaimer: The utilization of this indicator should complement a comprehensive analysis and not be solely relied upon for decision-making regarding long or short positions.
Webby's Quick & Grateful Dead RSWebby's Quick & Grateful Dead RS combines a Relative Strength Line and Moving Averages to help traders hold a core position in a winning stock by identifying moments of strength and weakness in a stocks advance.
The Relative Strength (RS) line is something many investors are familiar with. It is used to measure a stocks performance versus the S&P 500 (default setting) and is typically calculated by dividing the closing price of the stock by the closing price of the S&P. This means if a stock moves up and the S&P moves down or the stock moves up more than the S&P the RS line will increase, if the stock moves down while the S&P moves up the line will decrease.
While the RS Line by itself is a powerful tool, adding moving averages to the RS line can help better understand trends. This work was done by Mike Webster (Webby) as he tried to reverse engineer how William O'Neil was able to hold some of his biggest winning positions.
This indicator plots the RS line along with two moving averages and clearly labels and alerts the 3 signals shared by Webby:
Quick Break - RS line crosses below the fast moving average
Quicksand - RS line moves lower than it was at the time of the Quick Break
Grateful Dead Break - RS line crosses below the slow moving average
To ensure your chart doesn't get skewed, please use the multiplier in the setting to adjust the vertical offset of the RS line and moving averages.

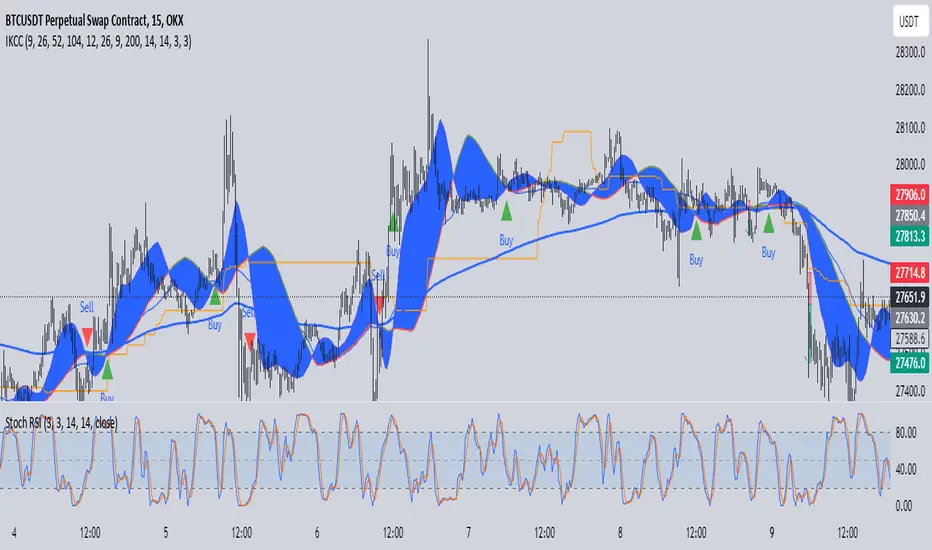
IchimokuBuy Sell With Stoch RSIIchimoku Kumo Cloud Crossover Indicator
The "Ichimoku Kumo Cloud Crossover" indicator is a custom technical analysis tool designed for use in the TradingView platform. This indicator is built to assist traders in identifying potential buy and sell signals based on a combination of Ichimoku Cloud analysis, Moving Average Convergence Divergence (MACD), Exponential Moving Average (EMA), Relative Strength Index (RSI), and Stochastic RSI.
Key Components and Parameters:
Ichimoku Kumo Cloud Calculation:
The Ichimoku Kumo Cloud is calculated using the Ichimoku Cloud's Conversion Line and Base Line.
Conversion Line, Base Line, Leading Span 1, and Leading Span 2:
These are key components of the Ichimoku Cloud, and they help identify trends and potential support/resistance levels in the market.
MACD Oscillator:
The Moving Average Convergence Divergence (MACD) is used to gauge the strength and direction of the trend.
EMA 200 (Exponential Moving Average):
The EMA 200 is a long-term moving average used to identify the overall trend direction.
RSI (Relative Strength Index):
The RSI is a momentum oscillator that measures the speed and change of price movements, helping to identify overbought and oversold conditions.
Stochastic RSI (Stoch RSI):
Stoch RSI is calculated based on the RSI values and helps to identify overbought and oversold conditions in a more dynamic manner.
Signal Generation:
The indicator generates buy and sell signals based on the following criteria:
Buy Signal (Long Position):
The Conversion Line crosses above the Base Line (Ichimoku Cloud crossover).
The closing price is above the EMA 200, indicating a bullish bias.
The RSI is between 50 and 70, suggesting the potential for an uptrend.
The MACD Histogram is positive, indicating increasing bullish momentum.
The high price is at least 25% above the EMA 200.
Sell Signal (Short Position):
The Conversion Line crosses below the Base Line (Ichimoku Cloud crossover).
The closing price is below the EMA 200, indicating a bearish bias.
The RSI is between 20 and 50, suggesting the potential for a downtrend.
The MACD Histogram is negative, indicating increasing bearish momentum.
The low price is at least 25% below the EMA 200.
Stoch RSI Filter:
Additionally, a filter based on Stoch RSI slope is applied. The indicator will only open a position if the Stoch RSI is declining for short positions (sell) and rising for long positions (buy).
Visualization:
Buy signals are marked with green triangles below the bars.
Sell signals are marked with red triangles above the bars.
The Ichimoku Cloud is plotted in the background, with cloud colors changing based on whether the Conversion Line or Base Line is higher.
This indicator can be a valuable tool for traders looking to combine multiple technical analysis techniques to make informed trading decisions in the financial markets.
MA RSI @KINGThis Pine Script is designed to create a trading indicator with moving averages (MA) and relative strength index (RSI), along with arrow signals and background color changes based on those signals. Here's a description of its functions:
1. Moving Averages and RSI Calculation:
- Two moving averages (`fastMA` and `slowMA`) are calculated based on user-input lengths.
- The Relative Strength Index (`rsi`) is calculated based on a user-defined length.
2. Crossover Conditions:
- `crossoverUp` is true when the fastMA crosses above the slowMA and RSI is above an overbought level.
- `crossoverDown` is true when the fastMA crosses below the slowMA and RSI is below an oversold level.
3. Arrow Signals:
- Triangle-shaped arrows (`arrowUp` and `arrowDown`) are plotted below and above bars, indicating buy (green) and sell (red) signals, respectively.
4. Background Color Changes:
- The background color (`bgColor`) changes based on buy and sell signals.
- If there's a buy signal (`crossoverUp`), the background color is set to a light blue with 40% transparency.
- If there's a sell signal (`crossoverDown`), the background color is set to a light red with 40% transparency.
- On the next opposite signal, the background color is scaled up (transparency set to 80%) to indicate a stronger signal.
In summary, this script provides visual cues through arrows and background color changes to assist traders in identifying potential buy and sell signals based on moving average crossovers and RSI conditions. The background color variations aim to highlight the strength of the signal, with scaling based on consecutive signals in the same direction.
********************************************************************************
1. Buy Signal:
- Condition: The arrow points up (green) with a background color indicating a buy signal.
- Confirmation: Ensure that there is a strong upward crossover (fastMA above slowMA) and RSI is above the overbought level.
2. Sell Signal:
- Condition: The arrow points down (red) with a background color indicating a sell signal.
- Confirmation: Ensure that there is a strong downward crossover (fastMA below slowMA) and RSI is below the oversold level.
3. Exit Signal:
- Condition: No arrow is present, and the background color is reset.
- Confirmation: Confirm that there is no active buy or sell signal.
Example Trading Rules:
Opening a Long Position (Buy):
- Enter a long (buy) position when:
- The green arrow appears with a light blue background.
- Confirm that the fastMA is above the slowMA.
- Confirm that RSI is above the overbought level.
Opening a Short Position (Sell):
- Enter a short (sell) position when:
- The red arrow appears with a light red background.
- Confirm that the fastMA is below the slowMA.
- Confirm that RSI is below the oversold level.
Exiting a Position:
- Close the position when:
- There is no arrow present (neither green nor red).
- The background color is reset, indicating no active signal.
Risk Management:
Position Sizing: Determine the size of your positions based on your risk tolerance and the size of your trading account.
Stop-Loss and Take-Profit: Set stop-loss orders to limit potential losses and take-profit orders to secure profits.
Risk-Reward Ratio: Consider maintaining a favorable risk-reward ratio in your trades.
Notes:
Backtesting: Before applying this strategy in a live market, it's crucial to backtest it using historical data to assess its performance.
Market Conditions: Adapt the strategy to different market conditions, and be aware that no strategy is guaranteed to be profitable.
Continuous Monitoring: Regularly monitor the performance of the strategy and make adjustments as needed.
Educational Purpose: This strategy is for educational purposes only. Always consult with financial professionals and use your judgment when making trading decisions.
Remember that trading involves risk, and past performance is not indicative of future results. It's recommended to paper trade or use a demo account to test the strategy before risking real capital.
Best wishes on your trading journey! May your strategies be profitable, your risks well-managed, and your decisions guided by wisdom and success. Happy trading!
Divergences RefurbishedJust as "a butterfly can flap its wings over a flower in China and cause a hurricane in the Caribbean" (Edward Lorenz), small divergences in markets can signal big trading opportunities.
█Introduction
This is a script forked from LonesomeTheBlue's Divergence for Many Indicators v4.
It is a script that checks for divergence between price and many indicators.
In this version, I added more indicators and also added 40 symbols to check for divergences.
More info on the original script can be found here:
█ Improvements
The following improvements have been implemented over v4:
1. Added parameters to customize indicators.
2. Added new indicators:
- Stoch RSI
- Volume Oscillator
- PVT (Price Volume Trend)
- Ultimate Oscillator
- Fisher Transform
- Z-Score/T-Score
3. Now there is the possibility of using 2 external indicators.
4. New option to show tooltips inside labels.
This allows you to save space on the screen if you choose the option to only show the number of divergences or just the abbreviations.
5. New option to show additional text next to the indicator name.
This allows for grouping of indicators and symbols and better visualization, whether through emojis, for example.
6. Added 40 customizable symbols to check for divergences.
7. Option "show only the first letter" of the indicator replaced by: "show the abbreviation of the indicator".
Reason: the indicator abbreviation is more informative and easier to read.
8. Script converted to PineScript version 5.
█ CONCEPTS
Below I present a brief description of the available indicators.
1. Moving Average Convergence/Divergence (MACD):
Shows the difference between short-term and long-term exponential moving averages.
2. MACD Histogram:
Shows the difference between MACD and its signal line.
3. Relative Strength Index (RSI):
Measures the relative strength of recent price gains to recent price losses of an asset.
4. Stochastic Oscillator (Stoch):
Compares the current price of an asset to its price range over a specified time period.
5. Stoch RSI:
Stochastic of RSI.
6. Commodity Channel Index (CCI):
Measures the relationship between an asset's current price and its moving average.
7. Momentum: Shows the difference between the current price and the price a few periods ago.
Shows the difference between the current price and the price of a certain period in the past.
8. Chaikin Money Flow (CMF):
A variation of A/D that takes into account the daily price variation and weighs trading volume accordingly. Accumulation/Distribution (A/D) identifies buying and selling pressure by tracking the flow of money into and out of an asset based on volume patterns.
9. On-Balance Volume (OBV):
Identify divergences between trading volume and an asset's price.
Sum of trading volume when the price rises and subtracts volume when the price falls.
10. Money Flow Index (MFI):
Measures volume pressure in a range of 0 to 100.
Calculates the ratio of volume when the price goes up and when the price goes down.
11. Volume Oscillator (VO):
Identify divergences between trading volume and an asset's price. Ratio of change of volume, from a fast period in relation to a long period.
12. Price-Volume Trend (PVT):
Identify the strength of an asset's price trend based on its trading volume. Cumulative change in price with volume factor. The PVT calculation is similar to the OBV calculation, but it takes into account the percentage price change multiplied by the current volume, plus the previous PVT value.
13. Ultimate Oscillator (UO):
Combines three different time periods to help identify possible reversal points.
14. Fisher Transform (FT):
Normalize prices into a Gaussian normal distribution.
15. Z-Score/T-Score: Shows the difference between the current price and the price a few periods ago. I is a statistical measurement that indicates how many standard deviations a data point is from the mean of a data set.
When to use t-score instead of z-score? When the sample size is small (length < 30).
Here, the use of z-score or t-score is chosen automatically based on the length parameter.
█ What to look for
The operation is simple. The script checks for divergences between the price and the selected indicators.
Now with the possibility of using multiple symbols, it is possible to check divergences between different assets.
A well-described view on divergences can be found in this cheat sheet:
◈ Examples with SPY ETF versus indicators:
1. Regular bullish divergence with external indicator:
1. Regular bearish divergence with Fisher Transform:
1. Positive hidden divergence with Momentum indicator:
1. Negative hidden divergence with RSI:
◈ Examples with SPY ETF versus other symbols:
1. Regular bearish divergence with European Stoch Market:
2. Regular bearish divergence with DXY inverted:
3. Regular bullish divergence with Taiwan Dollar:
4. Regular bearish divergence with US10Y (10-Year US Treasury Note):
5. Regular bullish divergence with QQQ ETF (Nasdaq 100):
6. Regular bullish divergence with ARKK ETF (ARK Innovation):
7.Positive hidden divergence with RSP ETF (S&P 500 Equal Weight):
8. Negative hidden divergence with EWZ ETF (Brazil):
◈ Examples with BTCUSD versus other symbols:
1. Regular bearish divergence with BTCUSDLONGS from Bitfinex:
2. Regular bearish divergence with BLOK ETF (Amplify Transformational Data Sharing):
3. Negative hidden divergence with NATGAS (Natural Gas):
4. Positive hidden divergence with TOTALDEFI (Total DeFi Market Cap):
█ Conclusion
The symbols available to check divergences were chosen in such a way as to cover the main markets, in the most generic way possible.
You can adjust them according to your needs.
A trader in the American market, for example, could add more ETFs, American stocks, and sectoral indices, such as the XLF (Financial Select Sector SPDR Fund), the XLK (Technology Select Sector SPDR), etc.
On the other hand, a cryptocurrency trader could add more currency pairs and sector indicators, such as BTCUSDSHORTS (Bitfinex), USDT.D (Tether Dominance), etc.
If the chart becomes too cluttered, you can use the option to show only the number of divergences or only the indicator abbreviations.
Or even disable certain indicators and symbols, if they are not of interest to you.
I hope this script is useful.
Don't forget to support LonesomeTheBlue's work too.

Xeeder - Comparison RSI IndicatorXeeder - Comparison RSI Indicator (CRI)
The "Xeeder - Comparison RSI Indicator" (CRI) is a sophisticated tool designed to assist traders in analyzing and comparing the Relative Strength Index (RSI) and Moving Averages (MA) of two different securities simultaneously. This indicator is instrumental in identifying potential shifts in market momentum and strength between two assets.
Details of the Indicator:
Security Input Settings: This feature allows traders to input the symbols of two securities they wish to compare. The input is facilitated through text boxes where traders can enter the ticker symbols of their chosen securities.
Moving Average (MA) Settings: Traders have the option to select different types of moving averages such as SMA, EMA, WMA, among others. The settings also allow for the adjustment of the length of the moving average and the standard deviation multiplier for Bollinger Bands.
RSI Settings: This section allows traders to specify the length of the RSI calculation, which is used to analyze the momentum of the securities.
Dynamic RSI and MA Plotting: The indicator plots the RSI and its moving average for both securities dynamically on the chart, with distinct colors for easy differentiation and analysis.
RSI Bands: The indicator displays multiple RSI bands (Upper Band 1 & 2, Middle Band, Lower Band 1 & 2) as dashed horizontal lines, helping traders identify potential overbought and oversold regions.
Gradient Fill for Overbought and Oversold Regions: The indicator features a gradient fill between the RSI plot and the middle line, visually representing the overbought and oversold regions in different colors.
How to Use the Indicator:
Input Security Symbols: Start by entering the symbols of the two securities you wish to compare in the respective input boxes.
Configure MA and RSI Settings: Adjust the settings for the moving average type, length, and RSI length according to your trading strategy and analysis needs.
Analyze RSI and MA Plots: Observe the plotted RSI and moving averages for both securities to analyze and compare their momentum and trend characteristics.
Utilize RSI Bands: Use the RSI bands as reference points to identify potential overbought and oversold regions, and to gauge the relative strength between the two securities.
Interpret Gradient Fill: Pay attention to the gradient fill regions which visually represent overbought and oversold conditions, assisting in the identification of potential reversal points.
Example of Usage:
As a trader with a knack for developing innovative trading strategies, you can utilize the CRI indicator to enhance your swing trading approach. Here's how you might integrate this tool into your strategy:
Select Securities: Choose two securities that you are interested in comparing, perhaps from sectors you have identified as having potential based on your macroeconomic and geopolitical analysis.
Adjust Settings: Configure the RSI and MA settings to align with the characteristics of the selected securities and your trading strategy.
Analysis and Comparison: Analyze the RSI and MA plots to identify potential divergences or correlations between the two securities, which might indicate trading opportunities.
Utilize RSI Bands: Use the RSI bands to identify potential entry and exit points, aligning them with your analysis of broader market conditions and your trading strategy.
Content Creation: Leverage the insights gained from using the CRI indicator to create captivating content for your audience, sharing your analysis and perspectives on the selected securities and market conditions.
Remember, the CRI indicator serves as a powerful tool in your trading arsenal, offering a unique perspective on market dynamics and facilitating a deeper analysis of securities. Always consider the broader market context and your trading strategy when utilizing this tool.

Buy Sell Volume SeparateDescription:
The script is designed to provide traders with a unique and comprehensive analysis of trading volume dynamics. Unlike existing scripts, the script offers a distinct advantage by presenting both buy and sell volumes on separate scales, simplifying trading decisions.
Key Features:
1. Dual Volume Scales: The script provides two separate volume scales, one for buy volumes and another for sell volumes. This separation allows to easily distinguish between buying and selling pressure, aiding in more precise trade entries and exits.
2. Clear and Intuitive Chart: The script ensures that the chart it generates is clean and easy to understand. The buy and sell volumes are color-coded for clarity, and you can quickly identify significant volume spikes and trends.
How to Use:
1. Adding the Script: To use the script, simply add it to your TradingView chart.
2. Interpreting Buy and Sell Volumes: On the chart, you will see two separate volume scales—one for buy volumes and one for sell volumes. Green bars represent buying pressure, while red bars indicate selling pressure. Pay attention to the relative strengths and patterns of these bars to gauge market sentiment.
3. Informed Trading Decisions: Armed with insights into both buy and sell volumes, you can make more informed trading decisions. Look for divergences, patterns, or significant volume spikes to identify potential entry and exit points.

Multi-Asset Performance [Spaghetti] - By LeviathanThis indicator visualizes the cumulative percentage changes or returns of 30 symbols over a given period and offers a unique set of tools and data analytics for deeper insight into the performance of different assets.
Multi Asset Performance indicator (also called “Spaghetti”) makes it easy to monitor the changes in Price, Open Interest, and On Balance Volume across multiple assets simultaneously, distinguish assets that are overperforming or underperforming, observe the relative strength of different assets or currencies, use it as a tool for identifying mean reversion opportunities and even for constructing pairs trading strategies, detect "risk-on" or "risk-off" periods, evaluate statistical relationships between assets through metrics like correlation and beta, construct hedging strategies, trade rotations and much more.
Start by selecting a time period (e.g., 1 DAY) to set the interval for when data is reset. This will provide insight into how price, open interest, and on-balance volume change over your chosen period. In the settings, asset selection is fully customizable, allowing you to create three groups of up to 30 tickers each. These tickers can be displayed in a variety of styles and colors. Additional script settings offer a range of options, including smoothing values with a Simple Moving Average (SMA), highlighting the top or bottom performers, plotting the group mean, applying heatmap/gradient coloring, generating a table with calculations like beta, correlation, and RSI, creating a profile to show asset distribution around the mean, and much more.
One of the most important script tools is the screener table, which can display:
🔸 Percentage Change (Represents the return or the percentage increase or decrease in Price/OI/OBV over the current selected period)
🔸 Beta (Represents the sensitivity or responsiveness of asset's returns to the returns of a benchmark/mean. A beta of 1 means the asset moves in tandem with the market. A beta greater than 1 indicates the asset is more volatile than the market, while a beta less than 1 indicates the asset is less volatile. For example, a beta of 1.5 means the asset typically moves 150% as much as the benchmark. If the benchmark goes up 1%, the asset is expected to go up 1.5%, and vice versa.)
🔸 Correlation (Describes the strength and direction of a linear relationship between the asset and the mean. Correlation coefficients range from -1 to +1. A correlation of +1 means that two variables are perfectly positively correlated; as one goes up, the other will go up in exact proportion. A correlation of -1 means they are perfectly negatively correlated; as one goes up, the other will go down in exact proportion. A correlation of 0 means that there is no linear relationship between the variables. For example, a correlation of 0.5 between Asset A and Asset B would suggest that when Asset A moves, Asset B tends to move in the same direction, but not perfectly in tandem.)
🔸 RSI (Measures the speed and change of price movements and is used to identify overbought or oversold conditions of each asset. The RSI ranges from 0 to 100 and is typically used with a time period of 14. Generally, an RSI above 70 indicates that an asset may be overbought, while RSI below 30 signals that an asset may be oversold.)
⚙️ Settings Overview:
◽️ Period
Periodic inputs (e.g. daily, monthly, etc.) determine when the values are reset to zero and begin accumulating again until the period is over. This visualizes the net change in the data over each period. The input "Visible Range" is auto-adjustable as it starts the accumulation at the leftmost bar on your chart, displaying the net change in your chart's visible range. There's also the "Timestamp" option, which allows you to select a specific point in time from where the values are accumulated. The timestamp anchor can be dragged to a desired bar via Tradingview's interactive option. Timestamp is particularly useful when looking for outperformers/underperformers after a market-wide move. The input positioned next to the period selection determines the timeframe on which the data is based. It's best to leave it at default (Chart Timeframe) unless you want to check the higher timeframe structure of the data.
◽️ Data
The first input in this section determines the data that will be displayed. You can choose between Price, OI, and OBV. The second input lets you select which one out of the three asset groups should be displayed. The symbols in the asset group can be modified in the bottom section of the indicator settings.
◽️ Appearance
You can choose to plot the data in the form of lines, circles, areas, and columns. The colors can be selected by choosing one of the six pre-prepared color palettes.
◽️ Labeling
This input allows you to show/hide the labels and select their appearance and size. You can choose between Label (colored pointed label), Label and Line (colored pointed label with a line that connects it to the plot), or Text Label (colored text).
◽️ Smoothing
If selected, this option will smooth the values using a Simple Moving Average (SMA) with a custom length. This is used to reduce noise and improve the visibility of plotted data.
◽️ Highlight
If selected, this option will highlight the top and bottom N (custom number) plots, while shading the others. This makes the symbols with extreme values stand out from the rest.
◽️ Group Mean
This input allows you to select the data that will be considered as the group mean. You can choose between Group Average (the average value of all assets in the group) or First Ticker (the value of the ticker that is positioned first on the group's list). The mean is then used in calculations such as correlation (as the second variable) and beta (as a benchmark). You can also choose to plot the mean by clicking on the checkbox.
◽️ Profile
If selected, the script will generate a vertical volume profile-like display with 10 zones/nodes, visualizing the distribution of assets below and above the mean. This makes it easy to see how many or what percentage of assets are outperforming or underperforming the mean.
◽️ Gradient
If selected, this option will color the plots with a gradient based on the proximity of the value to the upper extreme, zero, and lower extreme.
◽️ Table
This section includes several settings for the table's appearance and the data displayed in it. The "Reference Length" input determines the number of bars back that are used for calculating correlation and beta, while "RSI Length" determines the length used for calculating the Relative Strength Index. You can choose the data that should be displayed in the table by using the checkboxes.
◽️ Asset Groups
This section allows you to modify the symbols that have been selected to be a part of the 3 asset groups. If you want to change a symbol, you can simply click on the field and type the ticker of another one. You can also show/hide a specific asset by using the checkbox next to the field.

ScalpTrader RSIThis script is a customized Relative Strength Index (RSI) indicator with added functionality, notably the optional Bollinger Bands overlay.
At its core, the script calculates the RSI, which is a popular momentum indicator used in technical analysis to identify overbought and oversold conditions. It does this by taking the average gain and the average loss over a user-defined period (default is 14) to compute the relative strength, which is then transformed into the RSI.
Furthermore, this script provides the option to overlay Bollinger Bands on the RSI line. Bollinger Bands, consisting of a middle band (a moving average) with two outer bands (standard deviations of the middle band), are used to measure volatility and 'relative' high or low prices. When applied to the RSI, they can offer another perspective on the momentum and volatility of the market.
RSI plot values are colored green if above 50 and red if below 50 to give the trader a sense of bullish or bearish price action.
I hope you find the indicator useful. Enjoy.

Volume ValueWhen VelocityTitle: Volume ValueWhen Velocity Trading Strategy
▶ Introduction:
The " Volume ValueWhen Velocity " trading strategy is designed to generate long position signals based on various technical conditions, including volume thresholds, RSI (Relative Strength Index), and price action relative to the Simple Moving Average (SMA). The strategy aims to identify potential buy opportunities when specific criteria are met, helping traders capitalize on potential bullish movements.
▶ How to use and conditions
★ Important : Only on Spot Binance BINANCE:BTCUSDT
Name: Volume ValueWhen Velocity
Operating mode: Long on Spot BINANCE BINANCE:BTCUSDT
Timeframe: Only one hour
Market: Crypto
currency: Bitcoin only
Signal type: Medium or short term
Entry: All sections in the Technical Indicators and Conditions section must be saved to enter (This is explained below)
Exit: Based on loss limit and profit limit It is removed in the settings section
Backtesting:
⁃ Exchange: BINANCE BINANCE:BTCUSDT
⁃ Pair: BTCUSDT
⁃ Timeframe:1h
⁃ Fee: 0.1%
- Initial Capital: 1,000 USDT
- Position sizing: 500 usdt
-Trading Range: 2022-07-01 11:30 ___ 2023-07-21 14:30
▶ Strategy Settings and Parameters:
1. `strategy(title='Volume ValueWhen Velocity', ...`: Sets the strategy title, initial capital, default quantity type, default quantity value, commission value, and trading currency.
↬ Stop-Loss and Take-Profit Settings:
1. long_stoploss_value and long_stoploss_percentage : Define the stop-loss percentage for long positions.
2. long_takeprofit_value and long_takeprofit_percentage : Define the take-profit percentage for long positions.
↬ ValueWhen Occurrence Parameters:
1. occurrence_ValueWhen_1 and occurrence_ValueWhen_2 : Control the occurrences of value events.
2. `distance_value`: Specifies the minimum distance between occurrences of ValueWhen 1 and ValueWhen 2.
↬ RSI Settings:
1. rsi_over_sold and rsi_length : Define the oversold level and RSI length for RSI calculations.
↬ Volume Thresholds:
1. volume_threshold1 , volume_threshold2 , and volume_threshold3 : Set the volume thresholds for multiple volume conditions.
↬ ATR (Average True Range) Settings:
1. atr_small and atr_big : Specify the periods used to calculate the Average True Range.
▶ Date Range for Back-Testing:
1. start_date, end_date, start_month, end_month, start_year, and end_year : Define the date range for back-testing the strategy.
▶ Technical Indicators and Conditions:
1. rsi: Calculates the Relative Strength Index (RSI) based on the defined RSI length and the closing prices.
2. was_over_sold: Checks if the RSI was oversold in the last 10 bars.
3. getVolume and getVolume2 : Custom functions to retrieve volume data for specific bars.
4. firstCandleColor : Evaluates the color of the first candle based on different timeframes.
5. sma : Calculates the Simple Moving Average (SMA) of the closing price over 13 periods.
6. numCandles : Counts the number of candles since the close price crossed above the SMA.
7. atr1 : Checks if the ATR_small is less than ATR_big for the specified security and timeframe.
8. prevClose, prevCloseBarsAgo, and prevCloseChange : ValueWhen functions to calculate the change in the close price between specific occurrences.
9. atrval: A condition based on the ATR_value3.
▶ Buy Signal Condition:
Condition: A combination of multiple volume conditions.
buy_signal: The final buy signal condition that considers various technical conditions and their interactions.
▶ Long Strategy Execution:
1. The strategy will enter a long position (buy) when the buy_signal condition is met and within the specified date range.
2. A stop-loss and take-profit will be set for the long position to manage risk and potential profits.
▶ Conclusion:
The " Volume ValueWhen Velocity " trading strategy is designed to identify long position opportunities based on a combination of volume conditions, RSI, and price action. The strategy aims to capitalize on potential bullish movements and utilizes a stop-loss and take-profit mechanism to manage risk and optimize potential returns. Traders can use this strategy as a starting point for their own trading systems or further customize it to suit their preferences and risk appetite. It is crucial to thoroughly back-test and validate any trading strategy before deploying it in live markets.
↯ Disclaimer:
Risk Management is crucial, so adjust stop loss to your comfort level. A tight stop loss can help minimise potential losses. Use at your own risk.
How you or we can improve? Source code is open so share your ideas!
Leave a comment and smash the boost button!

RSI MTF [Market Yogi]The Multi-Time Frame RSI with Money Flow Index and Average is a powerful trading indicator designed to help traders identify overbought and oversold conditions across multiple time frames. It combines the Relative Strength Index (RSI) with the Money Flow Index (MFI) and provides an average value for better accuracy.
The Relative Strength Index (RSI) is a popular momentum oscillator that measures the speed and change of price movements. It oscillates between 0 and 100 and is used to identify overbought and oversold conditions in an asset. By incorporating the RSI across multiple time frames, this indicator offers a broader perspective on market sentiment.
In addition to the RSI, this indicator also includes the Money Flow Index (MFI). The MFI is a volume-based oscillator that measures the inflow and outflow of money into an asset. It takes into account both price and volume, providing insights into the strength and direction of buying and selling pressure.
By combining the RSI and MFI across multiple time frames, traders gain a comprehensive understanding of market dynamics. The indicator allows for comparing the RSI and MFI values across different time frames, enabling traders to identify divergences and potential trend reversals.
Furthermore, this indicator provides an average value of the multi-time frame RSI, offering a consolidated signal that helps filter out noise and enhance the accuracy of trading decisions.
Key Features:
1. Multi-Time Frame RSI: Combines the RSI across different time frames to provide a comprehensive view of market sentiment.
2. Money Flow Index (MFI): Incorporates the MFI to gauge buying and selling pressure based on both price and volume.
3. Average Calculation: Computes the average value of the multi-time frame RSI to generate a consolidated trading signal.
4. Divergence Detection: Enables traders to spot divergences between the RSI and MFI values, indicating potential trend reversals.
5. Overbought and Oversold Levels: Highlights overbought and oversold levels on the RSI, aiding in timing entry and exit points.
The Multi-Time Frame RSI with Money Flow Index and Average is a versatile tool that can be applied to various trading strategies, including trend following, swing trading, and mean reversion. Traders can adjust the time frame settings to suit their preferences and trading style.
Note: It's important to use this indicator in conjunction with other technical analysis tools and indicators to validate signals and make informed trading decisions.

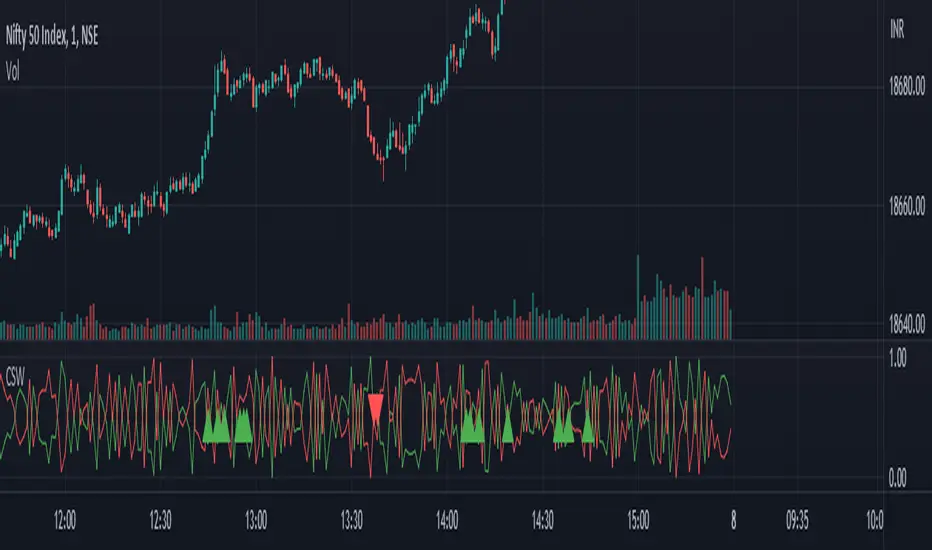
Candlestick Strength and Weakness with RSI and OBVThe "Candlestick Strength and Weakness with RSI and OBV" indicator, denoted as CSW, is a tool designed to assist traders in identifying potential trend reversals in financial markets. The CSW indicator combines the analysis of candlestick patterns, relative strength index (RSI), and on-balance volume (OBV) to provide traders with valuable insights into market dynamics.
The CSW indicator calculates the strength and weakness of each candlestick based on its open, close, high, and low prices. It considers the body range, upper shadow range, and lower shadow range of the candlestick to determine the distribution of strength and weakness within it. By quantifying the candlestick's strength and weakness, the indicator provides a visual representation of the balance between bullish and bearish forces in the market.
In addition to candlestick analysis, the CSW indicator incorporates RSI and OBV calculations to further validate potential trend reversals. The RSI is a widely-used momentum oscillator that measures the speed and change of price movements. The OBV, on the other hand, tracks the cumulative volume flow and helps identify periods of accumulation or distribution. By considering these indicators alongside candlestick strength and weakness, the CSW indicator enhances the accuracy of its signals.
To interpret the CSW indicator effectively, traders should consider the following:
Candlestick Strength and Weakness: The indicator plots two lines, "Candle Strength" and "Candle Weakness," representing the strength and weakness of each candlestick. The strength line indicates the bullish pressure, while the weakness line represents the bearish pressure.
Potential Reversal Signals: The CSW indicator identifies potential trend reversals based on the balance between candlestick strength and weakness, RSI readings, and OBV values. A bullish reversal signal occurs when the strength is higher than weakness, the RSI is below 30 (indicating oversold conditions), and the OBV is below its 20-period simple moving average (SMA). Conversely, a bearish reversal signal occurs when the weakness is higher than strength, the RSI is above 70 (indicating overbought conditions), and the OBV is above its 20-period SMA.
Trend Confirmation: The CSW indicator provides additional confirmation by comparing the closing price with the 20-period exponential moving average (EMA). If the closing price is above the EMA, it suggests an uptrend, while a closing price below the EMA indicates a downtrend.
Traders can add the indicator to their charts and customize its parameters based on their preferences. By monitoring the indicator's plots and observing the occurrence of potential reversal signals in alignment with the trend confirmation, traders can make informed decisions regarding entry or exit points in their trading strategies.
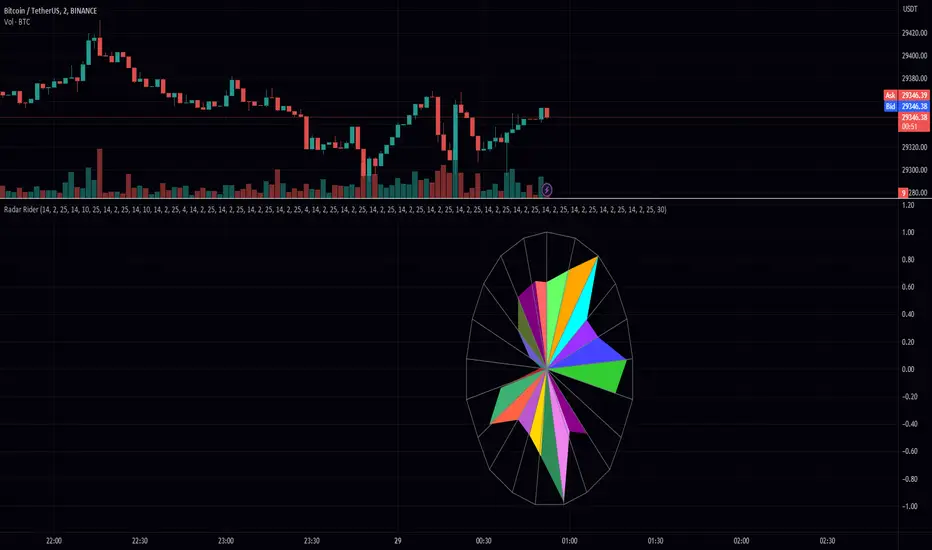
Radar RiderThe Radar Rider indicator is a powerful tool that combines multiple technical indicators into a single spider plot, providing traders with a comprehensive view of market conditions. This article will delve into the workings of each built-in indicator and their arrangement within the spider plot. To better understand the structure of the script, let's first examine some of the primary functions and how they are utilized in the script.
Normalize Function: normalize(close, len)
The normalize function takes the close price and a length as arguments and normalizes the price data by scaling it between 0 and 1, making it easier to compare different indicators.
Exponential Moving Average (EMA) Filter: bes(source, alpha)
The EMA filter is used to smooth out data using an exponential moving average, with the given alpha value defining the level of smoothing. This helps reduce noise and enhance the trend-following characteristics of the indicators.
Maximum and Minimum Functions: max(src) and min(src)
These functions find the maximum and minimum values of the input data over a certain period, respectively. These values are used in the normalization process and can help identify extreme conditions in the market.
Min-Max Function: min_max(src)
The min-max function scales the input data between 0 and 100 by dividing the difference between the data point and the minimum value by the range between the maximum and minimum values. This standardizes the data, making it easier to compare across different indicators.
Slope Function: slope(source, length, n_len, pre_smoothing = 0.15, post_smoothing = 0.7)
The slope function calculates the slope of a given data source over a specified length, and then normalizes it using the provided normalization length. Pre-smoothing and post-smoothing values can be adjusted to control the level of smoothing applied to the data before and after calculating the slope.
Percent Function: percent(x, y)
The percent function calculates the percentage difference between two values, x and y. This is useful for comparing the relative change in different indicators.
In the given code, there are multiple indicators included. Here, we will discuss each of them in detail.
EMA Diff:
The Exponential Moving Average (EMA) Diff is the difference between two EMA values of different lengths. The EMA is a type of moving average that gives more weight to recent data points. The EMA Diff helps traders identify trends and potential trend reversals. In the code, the EMA Diff is calculated using the ema_diff() function, which takes length, close, filter, and len_norm as parameters.
Percent Rank EMA Diff:
The Percent Rank EMA Diff is the percentage rank of the EMA Diff within a given range. It helps traders identify overbought or oversold conditions in the market. In the code, the Percent Rank EMA Diff is calculated using the percent_rank_ema_diff() function, which takes length, close, filter, and len_norm as parameters.
EMA Diff Longer:
The EMA Diff Longer is the difference between two EMA values of different lengths, similar to EMA Diff but with a longer period. In the code, the EMA Diff Longer is calculated using the ema_diff_longer() function, which takes length, close, filter, and len_norm as parameters.
RSI Filter:
The Relative Strength Index (RSI) is a momentum oscillator that measures the speed and change of price movements. The RSI Filter is the RSI value passed through a filter to smooth out the data. In the code, the RSI Filter is calculated using the rsi_filter() function, which takes length, close, and filter as parameters.
RSI Diff Normalized:
The RSI Diff Normalized is the normalized value of the derivative of the RSI. It helps traders identify potential trend reversals in the market. In the code, the RSI Diff Normalized is calculated using the rsi_diff_normalized() function, which takes length, close, filter, len_mad, and len_norm as parameters.
Z Score:
The Z Score is a statistical measurement that describes a value's relationship to the mean of a group of values. In the context of the code, the Z Score is calculated for the closing price of a security. The z_score() function takes length, close, filter, and len_norm as parameters.
EMA Normalized:
The EMA Normalized is the normalized value of the EMA, which helps traders identify trends and potential trend reversals in the market. In the code, the EMA Normalized is calculated using the ema_normalized() function, which takes length, close, filter, and len_norm as parameters.
WMA Volume Normalized:
The Weighted Moving Average (WMA) Volume Normalized is the normalized value of the WMA of the volume. It helps traders identify volume trends and potential trend reversals in the market. In the code, the WMA Volume Normalized is calculated using the wma_volume_normalized() function, which takes length, volume, filter, and len_norm as parameters.
EMA Close Diff Normalized:
The EMA Close Diff Normalized is the normalized value of the derivative of the EMA of the closing price. It helps traders identify potential trend reversals in the market. In the code, the EMA Close Diff Normalized is calculated using the ema_close_diff_normalized() function, which takes length, close, filter, len_mad, and len_norm as parameters.
Momentum Normalized:
The Momentum Normalized is the normalized value of the momentum, which measures the rate of change of a security's price. It helps traders identify trends and potential trend reversals in the market. In the code, the Momentum Normalized is calculated using the momentum_normalized() function, which takes length, close, filter, and len_norm as parameters.
Slope Normalized:
The Slope Normalized is the normalized value of the slope, which measures the rate of change of a security's price over a specified period. It helps traders identify trends and potential trend reversals in the market. In the code, the Slope Normalized is calculated using the slope_normalized() function, which takes length, close, filter, and len_norm as parameters.
Trend Intensity:
Trend Intensity is a measure of the strength of a security's price trend. It is based on the difference between the average of price increases and the average of price decreases over a given period. The trend_intensity() function in the code calculates the Trend Intensity by taking length, close, filter, and len_norm as parameters.
Volatility Ratio:
The Volatility Ratio is a measure of the volatility of a security's price, calculated as the ratio of the True Range (TR) to the Exponential Moving Average (EMA) of the TR. The volatility_ratio() function in the code calculates the Volatility Ratio by taking length, high, low, close, and filter as parameters.
Commodity Channel Index (CCI):
The Commodity Channel Index (CCI) is a momentum-based oscillator used to help determine when an investment vehicle is reaching a condition of being overbought or oversold. The CCI is calculated as the difference between the mean price of a security and its moving average, divided by the mean absolute deviation (MAD) of the mean price. In the code, the CCI is calculated using the cci() function, which takes length, high, low, close, and filter as parameters.
These indicators are combined in the code to create a comprehensive trading strategy that considers multiple factors such as trend strength, momentum, volatility, and overbought/oversold conditions. The combined analysis provided by these indicators can help traders make informed decisions and improve their chances of success in the market.
The Radar Rider indicator is a powerful tool that combines multiple technical indicators into a single, easy-to-read visualization. By understanding the inner workings of each built-in indicator and their arrangement within the spider plot, traders can better interpret market conditions and make informed trading decisions.
FTR, WMA, OBV & RSI StrategyThis Pine Script code is a trading strategy that uses several indicators such as Fisher Transform (FTR), On-Balance Volume (OBV), Relative Strength Index (RSI), and a Weighted Moving Average (WMA). The strategy generates buy and sell signals based on the conditions of these indicators.
The Fisher Transform function is a technical indicator that uses past prices to determine whether the current market is bullish or bearish. The Fisher Transform function takes in four multipliers and a length parameter. The four multipliers are used to calculate four Fisher Transform values, and these values are used in combination to determine if the market is bullish or bearish.
The Weighted Moving Average (WMA) is a technical indicator that smooths out the price data by giving more weight to the most recent prices.
The Relative Strength Index (RSI) is a momentum indicator that measures the strength of a security's price action. The RSI ranges from 0 to 100 and is typically used to identify overbought or oversold conditions in the market.
The On-Balance Volume (OBV) is a technical indicator that uses volume to predict changes in the stock price. OBV values are calculated by adding volume on up days and subtracting volume on down days.
The strategy uses the Fisher Transform values to generate buy and sell signals when all four Fisher Transform values change color. It also uses the WMA to determine if the trend is bullish or bearish, the OBV to confirm the trend, and the RSI to filter out false signals.
The red and green triangular arrows attempt to indicate that the trend is bullish or bearish and should not be traded against in the opposite direction. This helps with my FOMO :)
All comments welcome!
The script should not be relied upon alone, there are no stop loss or take profit filters. The best results have been back-tested using Tradingview on the 45m - 3 hour timeframes.

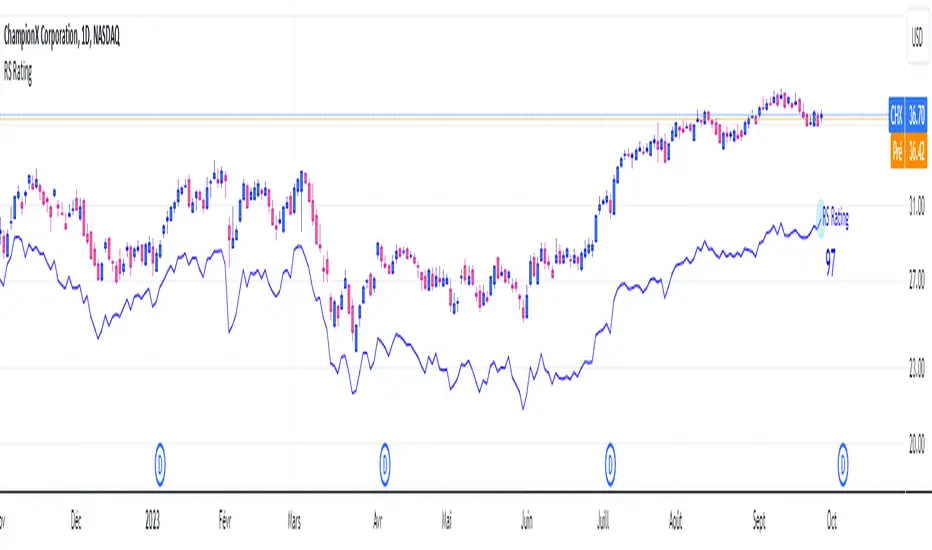
RS RatingHello everyone.
The RS Rating (or Relative Strenght Rating) is a metric that tracks a stock's price performance relative to the rest of the market. Specifically, it looks at a stock's relative strength over the last 52 weeks.
It allows you to identify at a glance stocks that are outperforming the market and may be poised for further gains.
Designed for break-out traders, trend follower, value investors, the RS Rating can help you identify promising opportunities and make informed investment decisions.
The Rating stands as follow:
- From 1 (worst) to 99 (best)
- 99 rating means the stock is outperforming 99% of all stocks in terms of relative share price performance over the last 52 weeks.
The RS Rating is accompanied by the RS line which is a representation of the progress of the asset against the comparative symbol. (Here SP500)
Of course this script is inspired by the IBD rating system.
The results may be equivalent but it is not guaranteed.
This indicator proposes a scoring system in the style of the one proposed by IBD.
Indeed for an optimal result, it would be necessary to compare the relative performance of all actions, which is not yet possible on PineScript.
Here is the formula for calculating the score:
RS Score = 40% * P3 + 20% * P6 + 20% * P9 + 20% * P12
With
P3 = Performance over the last 3 months
P6 = Performance over the last 6 months
P9 = Performance over the last 9 months
P12 = Performance over the last 12 months
There is no equivalent solution for the moment on TradingView.
The rating score will only appear on the daily timeframe.
For now it's my pleasure to share!
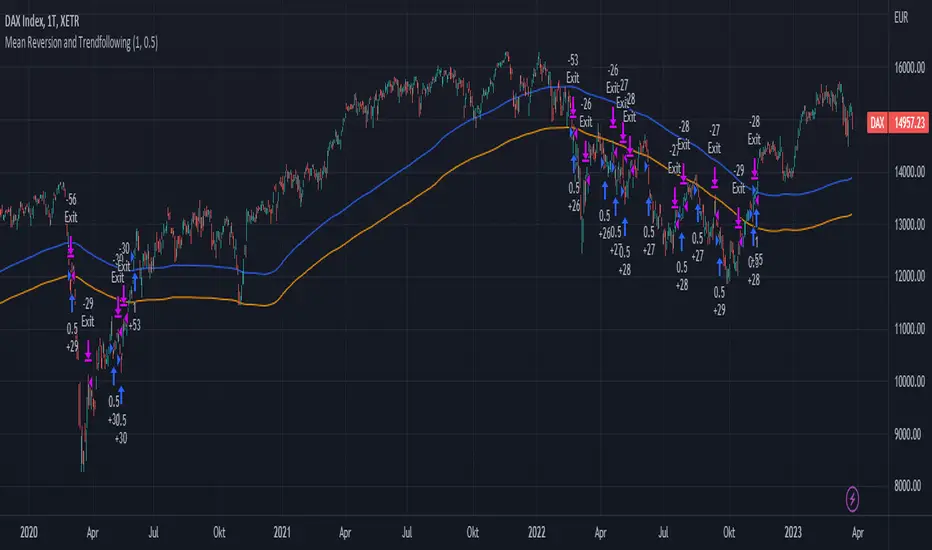
Mean Reversion and TrendfollowingTitle: Mean Reversion and Trendfollowing
Introduction:
This script presents a hybrid trading strategy that combines mean reversion and trend following techniques. The strategy aims to capitalize on short-term price corrections during a downtrend (mean reversion) as well as ride the momentum of a trending market (trend following). It uses a 200-period Simple Moving Average (SMA) and a 2-period Relative Strength Index (RSI) to generate buy and sell signals.
Key Features:
Combines mean reversion and trend following techniques
Utilizes 200-period SMA and 2-period RSI
Customizable starting date
Allows for enabling/disabling mean reversion or trend following modes
Adjustable position sizing for trend following and mean reversion
Script Description:
The script implements a trading strategy that combines mean reversion and trend following techniques. Users can enable or disable either of these techniques through the input options. The strategy uses a 200-period Simple Moving Average (SMA) and a 2-period Relative Strength Index (RSI) to generate buy and sell signals.
The mean reversion mode is active when the price is below the SMA200, while the trend following mode is active when the price is above the SMA200. The script generates buy signals when the RSI is below 20 (oversold) in mean reversion mode or when the price is above the SMA200 in trend following mode. The script generates sell signals when the RSI is above 80 (overbought) in mean reversion mode or when the price falls below 95% of the SMA200 in trend following mode.
Users can adjust the position sizing for both trend following and mean reversion modes using the input options.
To use this script on TradingView, follow these steps:
Open TradingView and load your preferred chart.
Click on the 'Pine Editor' tab located at the bottom of the screen.
Paste the provided script into the Pine Editor.
Click 'Add to Chart' to apply the strategy to your chart.
Please note that the past performance of any trading system or methodology is not necessarily indicative of future results. Always use proper risk management and consult a financial advisor before making any investment decisions.
------
The following is a summary of the underlying whitepaper (onlinelibrary.wiley.com) for this strategy:
This paper proposes a theory of securities market under- and overreactions based on two psychological biases: investor overconfidence about the precision of private information and biased self-attribution, which causes asymmetric shifts in investors' confidence as a function of their investment outcomes. The authors show that overconfidence implies negative long-lag autocorrelations, excess volatility, and public-event-based return predictability. Biased self-attribution adds positive short-lag autocorrelations (momentum), short-run earnings "drift," and negative correlation between future returns and long-term past stock market and accounting performance.
The paper explains that there is empirical evidence challenging the traditional view that securities are rationally priced to reflect all publicly available information. Some of these anomalies include event-based return predictability, short-term momentum, long-term reversal, high volatility of asset prices relative to fundamentals, and short-run post-earnings announcement stock price "drift."
The authors argue that investor overconfidence can lead to stock prices overreacting to private information signals and underreacting to public signals. This overreaction-correction pattern is consistent with long-run negative autocorrelation in stock returns, excess volatility, and further implications for volatility conditional on the type of signal. The market's tendency to over- or underreact to different types of information allows the authors to address the pattern that average announcement date returns in virtually all event studies are of the same sign as the average post-event abnormal returns.
Biased self-attribution implies short-run momentum and long-term reversals in security prices. The dynamic analysis based on biased self-attribution can also lead to a lag-dependent response to corporate events. Cash flow or earnings surprises at first tend to reinforce confidence, causing a same-direction average stock price trend. Later reversal of overreaction can lead to an opposing stock price trend.
The paper concludes by summarizing the findings, relating the analysis to the literature on exogenous noise trading, and discussing issues related to the survival of overconfident traders in financial markets.
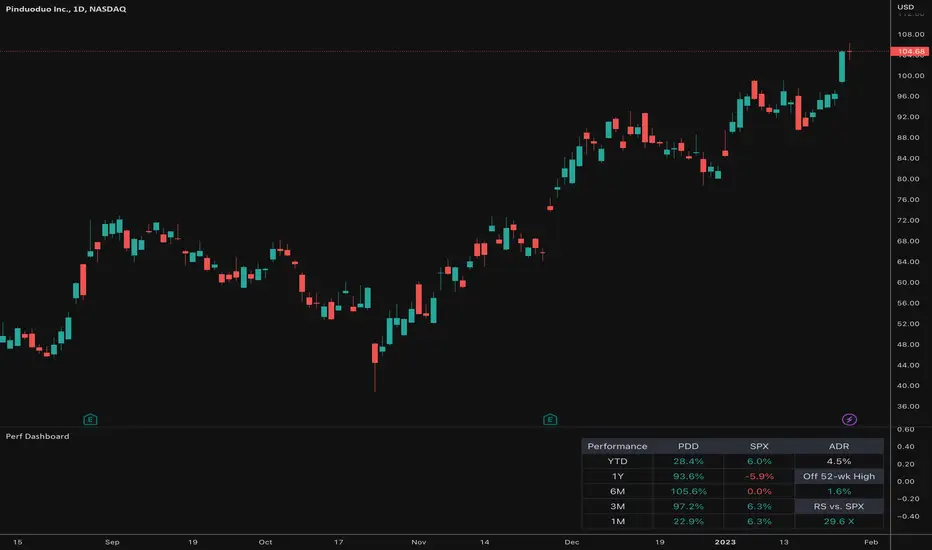
Relative Performance Dashboard v. 2This is a smaller and cleaner version of my previous Relative Performance table. It looks at the rate of change over 1M, 3M, 6M, 1YR & YTD and displays those for the current chart's ticker vs. an index/ticker of your choosing (SPX is default). I also have some fields for the ADR of the displayed chart, how far away the displayed chart is from 52-week highs, and a single number that compares the average relative strength of the displayed chart vs. the index. The way this average calculates is customizable by the user.
I like using this table next to an Earnings/Sales/Volume table that already exists by another user in the same pane and I designed this one so it can look just like that one to give a great view of the both fundamental and technical strength of your ticker in the same pane.
Keeping fundamental data independent from performance data allows you to still be able to see performance on things without fundamental data (i.e. ETFs, Indices, Crypto, etc.) as any script that uses fundamental data will not display when a chart that does not have fundamental data is displayed.
RSI & BB QQE Mod (highlight)This script is a combination of the RSI, QQE and BB
Here is an explanation on how I combined them, and how they are used:
- RSI (Relative Strength Index)
- Display a smoothed version of the RSI to identify "oversold" and "overbought" market phases
- Used to calculate a QQE
- QQE (Quantitative Qualitative Estimation)
- Used to identify trend direction and trend strength
- Used to set a basis for the BB
- BB (Bollinger Bands)
- Used with QQE as a basis to determine a relative definition of "high RSI" and "low RSI"
- Used with QQE as a basis to determine the volatility of the RSI at a given moment
- Used to predict pivot points
Here are the main signals:
- When "RSI Smoothed" line above the Upper BB then "RSI Smoothed" line turns green
- Also , display green background color highlight
- Also , and if "RSI Smoothed" is above the overbought line then display a second green background color highlight
- When "RSI Smoothed" line bellow the Lower BB then "RSI Smoothed" line turns red
- Also , display red background color highlight
- Also , and if "RSI Smoothed" is bellow the oversold line then display a second red background color highlight
A tool codded to be aesthetically pleasing and VERY customisable:
- Designed for both light theme and dark theme users
- Value can be easily modified in the settings
- Colors can be easily swapped in the settings
- Opacity of "fill" & "bgcolor" regrouped as a single input
A tool codded to be easy to read and to learn from:
- Sources and inspirations all listed within the script
- Structure easily identifiable (to understand with little to no effort how the script works)
Notes :
- This script is lagging, because of that I do recommend using it on relatively large timeframe
- This script is OpenSource, feel free to reuse it, but if so please remember to include a link to my script in your sources
- This script is not a magical tool, use at your own risk
